Accelerated Investigations — From Weeks to Hours
When an OOS result or process deviation occurs, the investigation starts immediately — not after 5–6 weeks of manual data gathering. ZONTAL traverses the scientific context graph to identify related batches, materials, methods, and prior events, producing a structured investigation package with full lineage.
Investigations Start with Weeks of Data Assembly
When a quality event triggers a formal investigation under 21 CFR 211.192, the first task is gathering data from every system that touched the batch. That process alone consumes weeks — before the actual root cause analysis even begins.
5–6 Weeks Just to Gather Data
Investigation teams manually pull records from LIMS, ELN, batch management, instrument databases, and environmental monitoring. Each system requires separate login, different query syntax, and manual data export — then reconciliation across formats.
No Cross-Program Visibility
Recurring deviations across batches, products, or sites remain invisible. The same root cause can trigger OOS events in multiple programs without anyone connecting the pattern — each investigation starts from zero.
Context Lost Between Systems
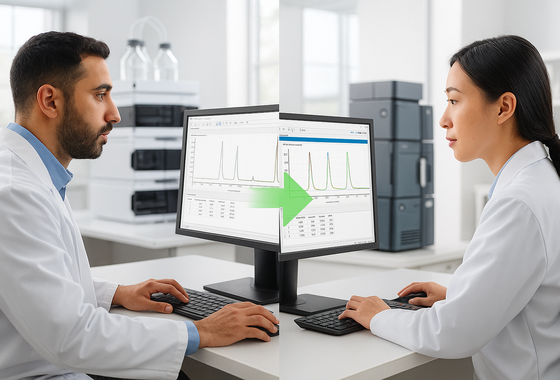
LIMS records the OOS result. ELN holds the method development rationale. SAP contains the batch production parameters. The connection between these records — the context that explains why a result is out of specification — exists only in the investigator's memory.
Context Graph Traversal — Every Related Entity, Instantly
ZONTAL replaces manual data assembly with automated context graph traversal. When an OOS or deviation event is detected, the intelligence engine identifies every related batch, material, method, instrument, and prior event — producing a structured investigation package with full lineage.
Event Detection
OOS/OOT result or process deviation is captured from LIMS, triggering the investigation workflow automatically. No manual notification required.
Context Traversal
The intelligence engine traverses the context graph: related batches, raw materials, method parameters, instrument logs, environmental data, and prior events for the same product line.
Root Cause Analysis
Statistical models correlate parameters across the gathered data. Logistic regression identifies high-risk factor combinations — such as water content deviations coinciding with compaction pressure excursions.
Investigation Package
Structured output with full lineage of every entity involved: batch genealogy, method history, instrument qualification status, environmental conditions, and prior deviation records.
Measurable Impact on Investigation Timelines
With governed data already connected in the context graph, investigation teams spend time on root cause analysis — not data assembly.
The Investigation Workflow — Step by Step
From the moment an OOS/OOT event is detected through CAPA closure, every step is governed, traceable, and connected to the scientific context graph.
OOS/OOT Detected
LIMS flags an out-of-specification or out-of-trend result. The event automatically enters the investigation queue.
Context Graph Traversal
Related batches, materials, methods, instruments, and environmental data are gathered via the governed context graph.
Root Cause Analysis
Statistical models identify correlated parameters. Logistic regression surfaces high-risk factor combinations across the data.
Investigation Package
Structured package generated: batch genealogy, method lineage, instrument qualification, environmental conditions, prior deviations.
CAPA & Closure
Corrective and preventive actions are tracked with full lineage. Closure requires evidence that the root cause is addressed.
Three Principles Compounding to Accelerate Investigations
Accelerated investigations compound from three principles working together. Each principle adds capability that the next builds on — from governed instrument data through scientific context to cross-program intelligence.
Integration Industrialization
Governed connectors to instruments, LIMS, ELN, and batch management systems ensure investigation data is already captured with consistent context — no manual extraction from disconnected databases.
- LIMS deviation records ingested automatically
- ELN method development rationale preserved
- SAP batch records linked with full lineage
- Instrument logs connected to batch context
Scientific Context & Lineage
The context graph connects batches to materials, methods, instruments, environmental conditions, and prior events. When an investigation is triggered, all related entities are already linked.
- Batch → material → method lineage
- Instrument qualification status at time of test
- Environmental monitoring data linked to batch
- Prior deviation history for same product line
Scientific Intelligence
Cross-program pattern detection, statistical root cause analysis, and deviation correlation across sites. The intelligence engine identifies relationships that manual investigation would miss.
- OOS root cause correlation across parameters
- Deviation pattern detection across batches/sites
- Impact assessment across product portfolio
- Historical deviation trend analysis


Trusted by 6 of the 10 largest pharmaceutical companies in the world
And leading biotechs and agrochemical companies
Build the Foundation for Accelerated Investigations
Walk through the investigation workflow with your own quality event data — from OOS detection through context traversal to structured investigation package and CAPA closure.